Case study · Web app
NeuroVista
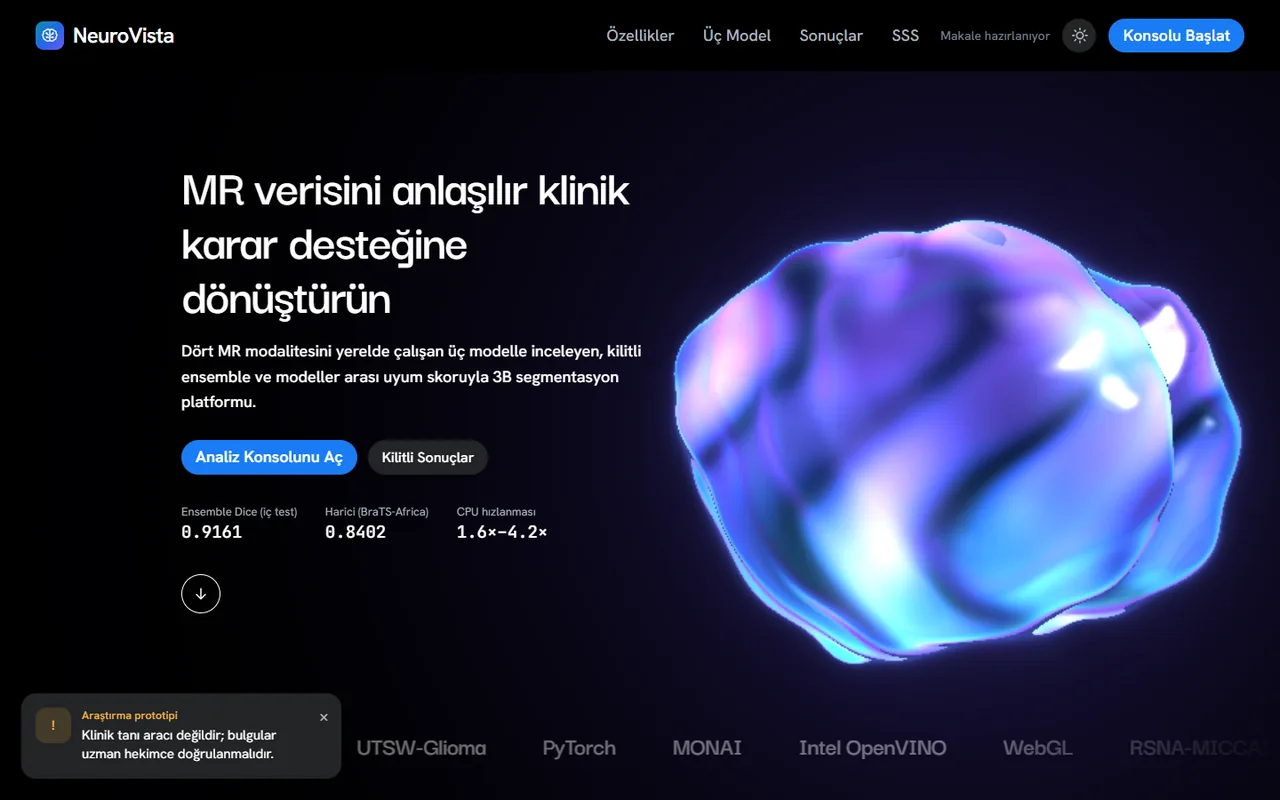
Three models that segment brain tumours in MRI scans and flag the cases they may get wrong.
Segmenting a brain tumour by hand in a 3D MRI scan is slow, and an automatic model that gives no hint of when it is wrong is hard to trust.
NeuroVista trains three architectures under one protocol and combines them. On the locked test set of 126 cases the ensemble reaches a 91.6% Dice score, and an agreement score between the models separates the failures without seeing the true labels.
- 91.6% Dice score of the ensemble on 126 locked test cases
- 3 architectures, trained under one protocol
- 300+ patients from other institutions in external validation
- 0.84 AUROC of the agreement score for finding failed cases
- Year
- 2026
- Role
- Sole developer
- Team
- Supervised by Assoc. Prof. Onur İnan, Selçuk University
- Built with
- Links
01
The challenge
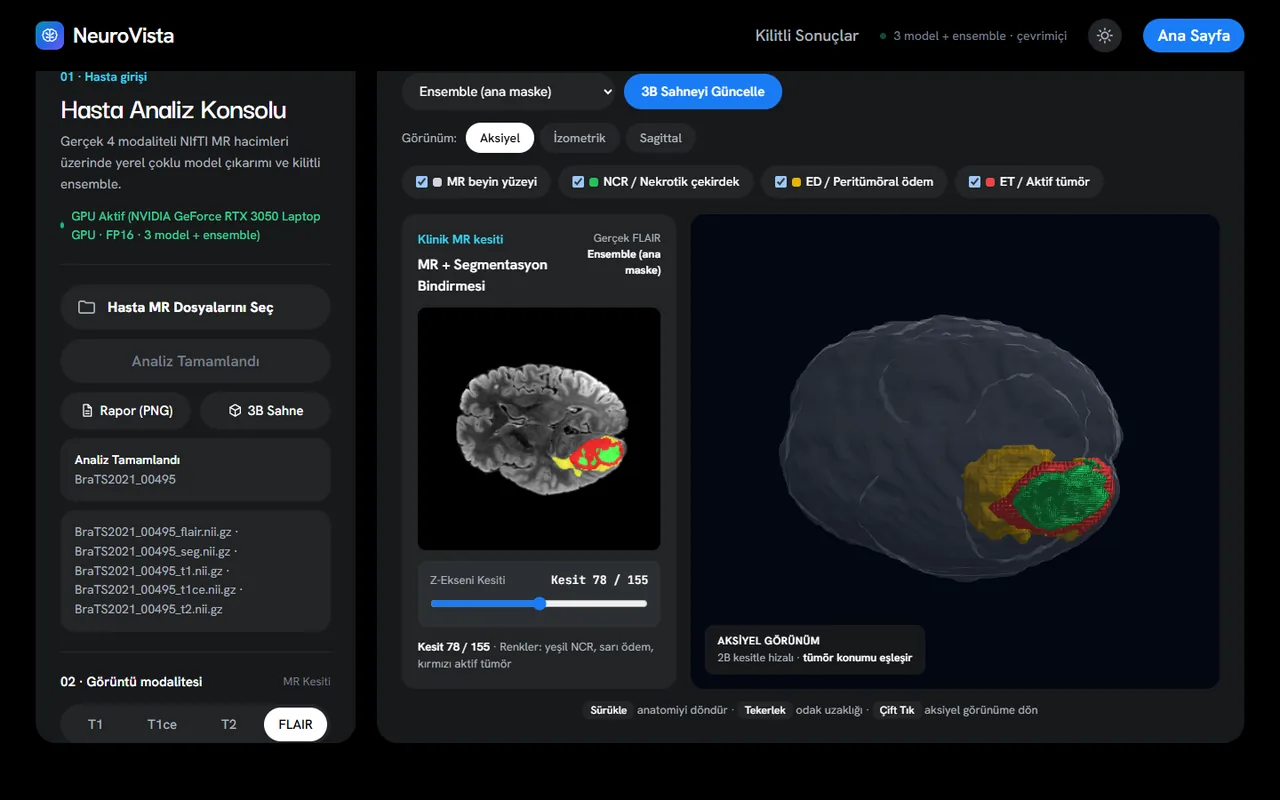
A tumour has three sub-regions (necrosis, oedema and active tumour) that must be separated in four MRI sequences at once. A model that scores well on its own hospital’s data can fall apart on another’s, and a clinician cannot tell in advance which case that will be.
The second difficulty was honesty. With three models, many settings and a single dataset it is easy to pick whatever looks best on the test set. The evaluation had to be designed so that could not happen.
Constraints
- Training data is BraTS 2021 only, 1,251 cases, split 1,000 / 125 / 126
- Developed and timed on a laptop GPU (RTX 3050)
02
My part
-
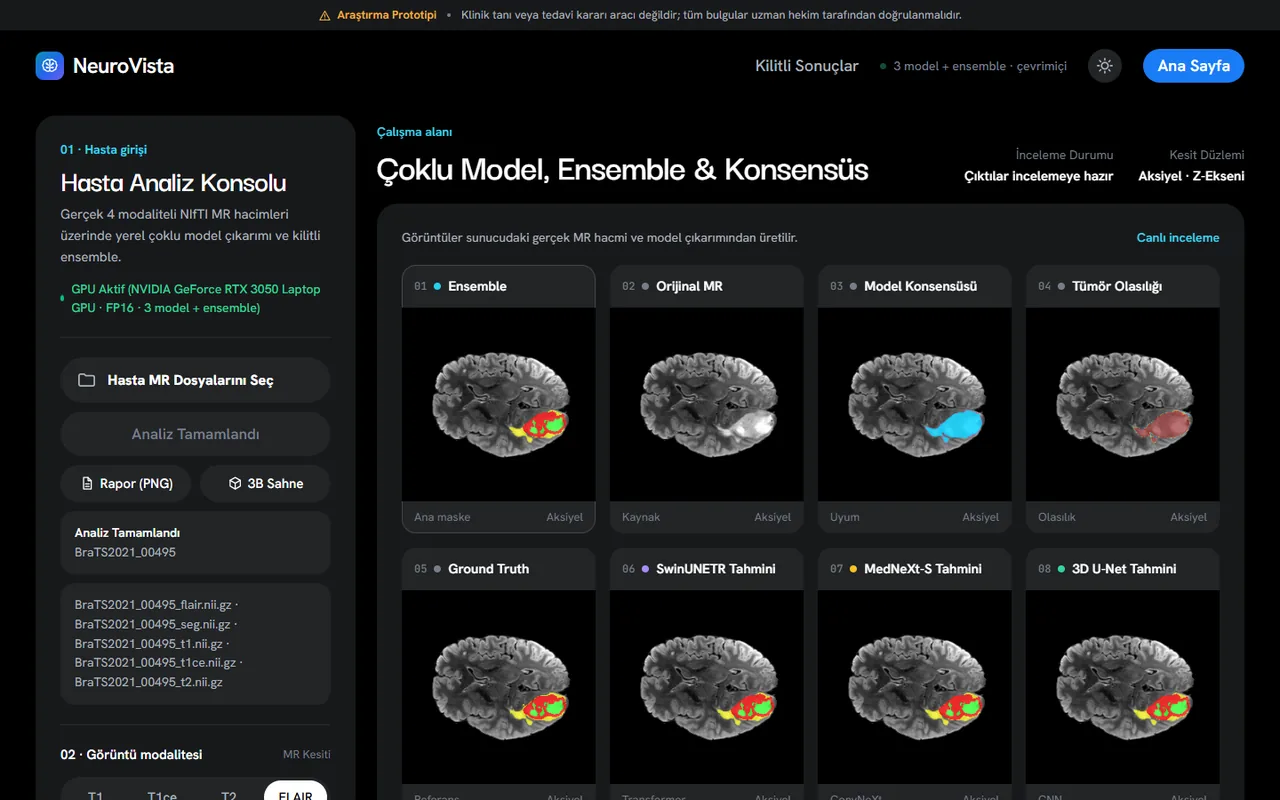
Trained the 3D U-Net, SwinUNETR and MedNeXt-S from scratch with the same data flow, budget and loss.
-
Designed the agreement score, the mean pairwise Dice between the three models’ masks.
-
Wrote the evaluation protocol: fixed seed, a test list locked with SHA-256 and rules written before the results.
-
Built the FastAPI web workstation and the desktop app (CustomTkinter and PyVista), with 3D surfaces, NIfTI export and PDF reports.
-
Added OpenVINO inference for machines without a GPU, with tests, a linter and CI.
-
Turned the results into a conference paper draft.
03
Key decisions
-
Same protocol for all three models
- Chose
- Same data flow, 80 epochs, DiceCE loss and AdamW with a cosine schedule for every architecture.
- Why
- A comparison is only fair if the architecture is the only thing that differs. Retraining under equal, sufficient budgets alone gained about one Dice point.
-
Lock the rules before seeing the test set
- Chose
- The ensemble method, mirror augmentation at test time and clean-up threshold were chosen on validation only and written down first.
- Why
- The test set was used exactly once, so the final numbers cannot have been tuned.
-
An agreement score instead of a confidence value
- Chose
- Disagreement between independent models marks the unreliable cases, with no ground truth needed.
- Why
- I wanted a warning that does not depend on one model’s opinion of itself. The score separated failed cases with an AUROC of 0.84 internally and up to 0.98 on outside cohorts, but it is an experimental indicator, not a validated clinical measure.
04
Results
On the internal test set the ensemble averages 0.916 Dice per patient, ahead of the best single model by about 0.2 points, a small gain that is statistically clear. Retraining as protocol v2 improved each earlier model by roughly one point.
Performance drops on other institutions’ data: 0.84 on BraTS-Africa (Nigeria) and 0.78 on UTSW (USA), where part of the gap comes from a different labelling rule for non-enhancing tumour. I reported these drops rather than hiding them. The system is a prototype and must not be used for diagnosis.
- Conference paper draft prepared; not yet submitted.
- Inference on one case takes about 6.5 seconds end to end on the laptop GPU.
Have a problem like this one?
Tell me what you are working on and I will get back to you.
kilichalit103@gmail.com